A year later and another state added
I added to my Tableau Public map project data on establishments welcoming African Americans in Georgia as listed in 1947 and 1956’s The Green Book. It’s taken me only a year. Or is it “it’s taken me a whole damn year?” Though I finished it pre-Covid-19 pandemic world it occurred to me that I should update the link in my last blog post. I should never leave dead links, even if I am the only one who knows.
Instead of uploading data for Arizona, as in next in alphabet after Alabama, as originally intended, I’m more interested in seeing patterns in geographical regions. Unfortunately, Georgia is far as I got. I hope it won’t take another year to add Mississippi. Sigh.
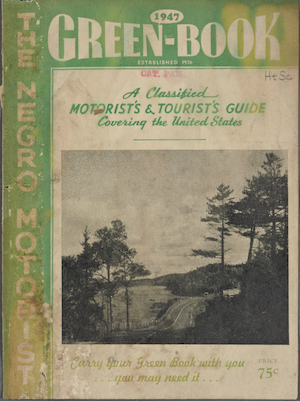
The Negro Motorist Green Book 1947, The Negro Travelers’ Green Book 1956

A DH project redux – Green Book data
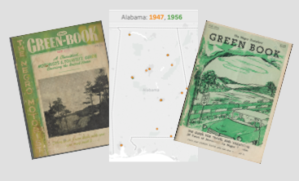
As noted in a previous post (see DH Praxis I), I began a project to map the establishments listed in The Green Book for the years 1947 and 1956. Unfortunately, it was way more challenging than I anticipated, mainly because the data was so messy. The JSON data for 1947 translated to CSV, thanks to a Grad Center DH fellow, turned out to be woefully incomplete, so I went back to the raw files and began the process of manual cleaning. This time I decided to be realistic and start small, and at the beginning of the alphabet with one state, Alabama. I anticipated seeing that there were more establishments in 1956 than in 1947. That was not the case; there were twenty-one establishments listed in 1947 and twenty in 1956. Due to WordPress limitations, the visualization can be found on the Tableau Public site.
The Negro Travelers’ Green Book Alabama (1947, 1956) on Tableau Public.
More to come…
The Capstone
I received an email message today about the number of times the white paper that accompanies the crowning glory of my pursuit of a second Master’s degree was downloaded; I took that as a sign for me to post an update here. This is my first online declaration of having reached the end of that pursuit. I am a proud owner of a 2019 Master’s of Arts in Liberal Studies from The Graduate Center, CUNY!
My goal was to produce a capstone project in digital form. And, I knew I wanted the discipline to be fashion studies based. Inspiration for my first idea came from the many women in my neighborhood who cover their heads to adhere to religious practices. The Muslim women wear colorful hijab wrapped and pinned in unique ways and the Hasidic women wear wigs in a relatively common style or a snood that covers their own hair. I imagined interviewing them, learning their roots and tracing their families’ origins on a map. I knew that was ambitious, especially since I would have only one day a week to do this in earnest. It didn’t take long for the reality check that my advisor gave me to sink in. She led me back to a paper I wrote on women of the Prohibition era. The fashion changes of that time were revolutionary. Hmmm… I was most inspired by the implications of the shift away from a silhouette that defined women for four centuries. The mighty corset could tell a story.

The visualizations on Visualizing the Decline of the Corset Business were developed using metadata from corset advertisements in women’s magazines in the early part of 20th century. There’s so much more to say, but the website and the white paper have it covered.
Reflections on digital humanities projects
With an information technology career behind me, and a brand new degree in Library Science, I looked forward to a new career where I could be a tech-savvy information professional instead of an information technology professional. This was in 2009, amid the ongoing heyday of Digital Humanities. How could I not be drawn to the shiny applications emerging from the Scholars Lab at University of Virginia (located in UVA’s library!) and other academic institutions. But, as shiny as these projects were, I wasn’t getting it. To really get them, I figured, I had to produce one.
While I didn’t get to produce my own project early on, I made my way into English classrooms as an embedded librarian supporting students working on digital projects. After a couple of years doing that, I returned to school once again and decided that it was now my turn. In the first class I took at The Graduate Center, Introduction to Liberal Studies, my professor was kind enough to accept my digital projects in lieu of traditional research papers. Both projects were research based visual narratives. I developed my first one in Omeka using the Neatline plugin, and the final one in Scalar. I was working with these technologies for the first time and I was eager to do a meta-analysis, assessing my work with unfamiliar technologies to represent digitally results from a research pursuit. The highlight of this journey would be the Digital Humanities classes I would later take.
DH Praxis I
In the first course in the Digital Humanities track students are immersed in theory. We were introduced to the myriad of scholarship on some form of digital humanities, and we spent more time than necessary rehashing the common question of how to define Digital Humanities. We read about and saw many compelling projects. Near the end of the semester it was time to create a data project of our own. I had a couple of ideas; one was less formed in my mind and it lacked the connection to a discipline, an important factor in my interest in digital humanities projects.

I knew about the Green Book Motorist Guide thanks to my colleague who introduced it in a class that we co-taught. The publisher, a postman from New York, compiled and published annually lists of accommodations and other establishments throughout the country that were known to be welcoming to Black people during the years 1936 to 1963. I knew that there was a wealth of data in those books. And, they were already digitized thanks to the New York Public Library and the University of South Carolina. Both organizations used the digitized data to develop maps representing where these establishments were. The NYPL’s application allows users to enter a starting location and a destination to see how far Black travelers had to drive to stay in a hotel near their destination, or how far they had to drive to get gas, or have a meal.
The aim of my research was to see the differences in the number of accommodations in locations throughout the country in the years 1947 and 1956. I started the effort of cleaning the data, enlisting the help of a digital fellow for scripts to automate that process. I planned to visualize the data in Tableau Public. That is as far as I got before the semester was over. I would continue working on it when I had more time, I told myself.
Before spring semester started, I collected latitude and longitude data but once again, work and classes took over and I had little time to continue. And, once again I told myself I would get back to it when I had more time.
DH Praxis II
I did not write a grant proposal for my data project in DH Praxis I because I didn’t get far enough with the Green Book data to think of a larger project. I didn’t comprehend that looking at the entire United States worth of locations for two years was overly ambitious. And I didn’t really get it until I had the chance to work on a reasonable size project with a team. When I get back to my Green Book project, I will be starting with one state.
Instead of polishing a grant proposal of an idea to pitch in DH Praxis II, I was assigned to peer review my classmates’ proposals. That exercise was productive. I used the NEH Digital Humanities grant proposal guidelines to base comments I gave to my peers.. If I were to write a grant proposal, I now know what should be included, what should be left out, and the style that a proposal should take in writing and format.
Evaluated proposals were returned and it was voting day for the projects that would be developed during the semester. I already had in mind that I wanted to work on Monika’s project, particularly because I was interested in the content. There were only nine of us in DH Praxis II so there would be three groups of three. A group of three seemed small for the ambitious projects proposed, but from the start our professors in both classes advised us to be realistic and focus on what was manageable.
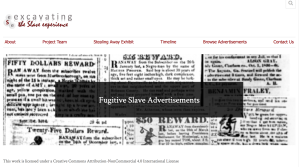
Once the groups were formed, we all established our roles within our groups. Monika came up with a name for the project, Excavating the Slave Experience (eSe). This title represents a larger project that she has in mind. For our group project, we focused on fugitive slave advertisements published in North Carolina newspapers from 1751 to 1863. We discussed software options and I pushed for Omeka because 1) I was familiar with it, and 2) we could develop map applications in it. We all agreed that it seemed like Omeka would support the goals of our project.
When roles were being established, I sat back and let others take over roles of project manager and developer, even though I had work experience as project manager, and I developed projects in Omeka. I accepted what came my way: to do some front end customization in Omeka and social media coordination. I had an instruction sheet that a colleague developed for batch uploads to Omeka using the CSV Import plugin, so that was to be my contribution outside my role.
Before long, roles were blurring and I offered to look at the data to find a meaningful way to pare down the dataset. I reduced by filtering out the advertisements that had less metadata than others, ultimately settling on about 205 advertisements out of the full set of over 2000.
Weeks went by. Schedules were off due to snow days and holidays but the data was still not uploaded to our site. That was not my job and I was apprehensive about usurping responsibilities. My apprehension gave way to panic for the good of the project and I took over as project manager and I uploaded the data to the site myself. With data uploaded, we could now get to work developing our site. I worked on the Omeka interface, mapped headings to Dublin Core metatadata elements, Tristen entered those mappings into the php file, and Monika set about her work on the maps. My task of social media and outreach came later, after we had something that represented what we wanted for our project.
We encountered a few hiccups along the way and reached out when we needed help. Before the maps were developed, I created a temporary exhibit but took it down because ultimately it did not serve the goals of our project. Once the map exhibit was ready, I enlisted colleagues to test and evaluate the site. I knew the shortcomings, specifically the limitations of the technology to support the custom maps so I was careful to not say too much, instead hoping that the project spoke for itself. I was pleased with the feedback as far as the perception of the project’s pedagogical impact, but the technology glitches were apparent.
My meta-analysis continues and I am still assessing what I got out of the project and what my interest level in digital humanities is at this point. I see the challenges of working with a small team on an ambitious project. As graduate students, we all have different levels of outside commitments and that was often reflected in the attention we were able to give the project. I can’t help but compare it to collaborations among employees in a work setting, where team members know they have an explicit understanding that the job must get done within a stated amount of time. That said, I’m pretty impressed with what we were able to accomplish. More thought will go into this, but that’s all I have for now.
It’s Inhuman
We are supposed to be able to find anything we want on the Internet, aren’t we? I do know that’s not the case, but occasionally, I am pretty wide eyed, especially when that anything is something I had access to not so long ago. Why wouldn’t I expect to again find that rare French film that a benevolent person uploaded to YouTube to be discovered by a classmate who kindly shared the link with me.
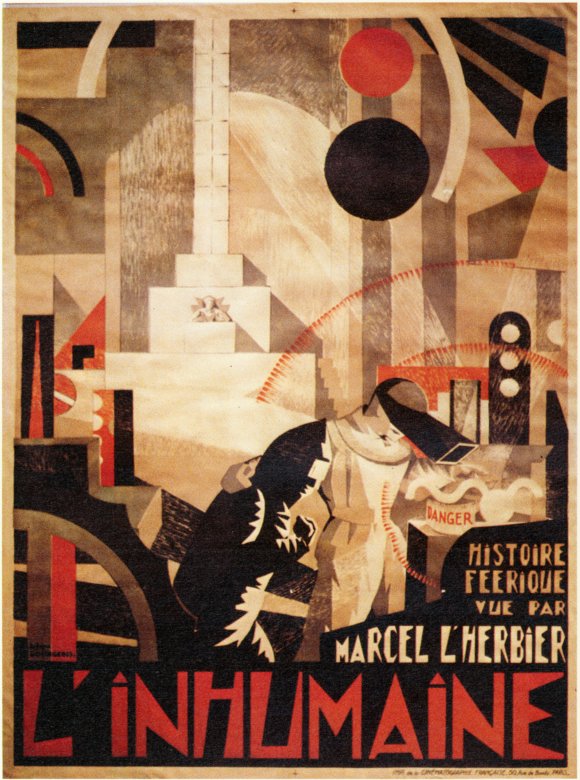
That was a month ago, and here I am, putting together the pieces for a digital project for my film class. My inspiration for this project happens to be a rare gem from 1924, L’Inhumaine, that I watched thanks to the chain of events mentioned above. Off I go to YouTube, eager to savor favorite details in the film that I hope to include in my project.

Oh no! Say it isn’t so! Say it isn’t so! It’s gone! Can’t be. Go back and check the link… pant, pant… search again…. a few times more. GONE!
Ye watchdogs of the web, protecting web publishers’ rights, I appeal to you. What about those of us who want nothing more than access to information for the benefit of curiosity about the world around? We suffer. That lone copy of an important film made briefly available, gives us a glimpse of an exciting period when artists were eager to work together in new medium.

Vintage Ad Browser
To you, Lobster Films, how wonderful of you to restore this treasure, and even endeavor to recreate Darius Milhaud’s composition. Have my cries to you been heard?
My peers in the academic libraries that have a copy in their holdings, my interlibrary loan requests go unfilled. Why have you forsaken me? Our mission is the same.
I forge ahead, being ever grateful for the enriching books, and access to them, that give me the confidence to proceed without the benefit of a deeper look at the film.
* Update, 11/7/2015: An academic library has come through! I have a VHS in hand to borrow for two weeks. Thank you!
Ask Brooklyn Museum
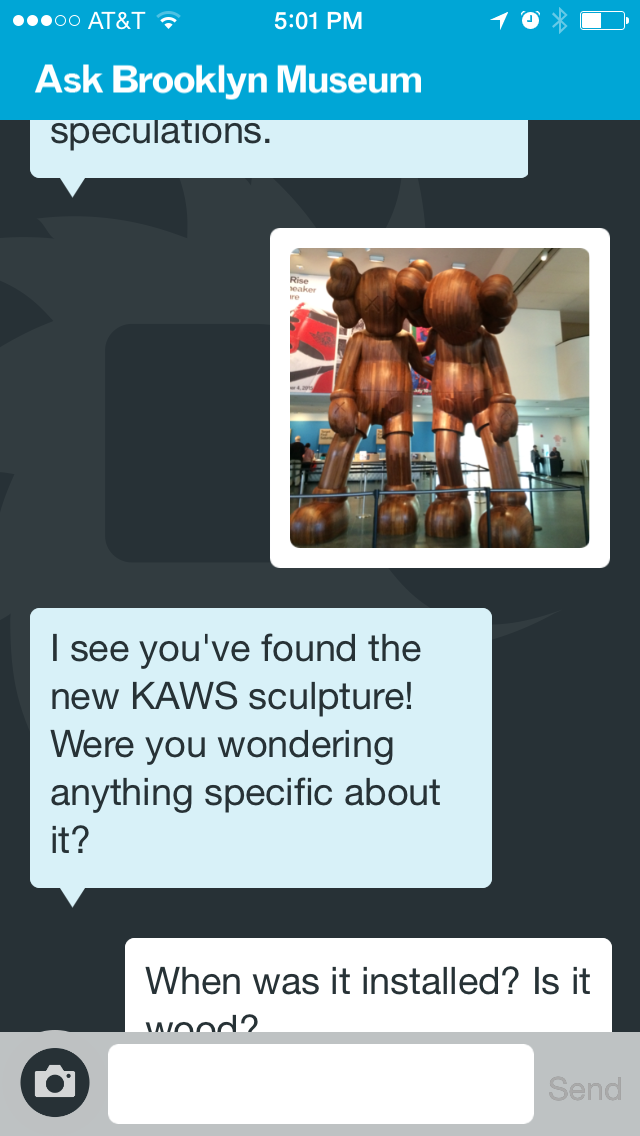
Last week my volunteer gig at the Brooklyn Museum was to help promote a new app, Ask. Ask engages Museum visitors with art. My role was to encourage visitors to download the app and use it. I helped visitors download the app, connect to the Brooklyn Museum wifi, turn on Bluetooth and toggle location services on for the app. Most visitors were tech savvy enough to require little assistance. But enough with the mundane.
A visitor snaps a photo using the app and the image is sent to the Audience Engagement team, the think tank behind Ask. These friendly, knowledgeable folks stand on the ready to engage visitors of the museum with the art in question. They are working with technology that includes a database of works in the Museum and they are continually building on a wiki that contains information about works as well as comparable styles, works, etc. The app works in real time; questions and answers are ephemeral. If you want to research further later, remember to take notes.
The team graciously gave me a demo at the end of my shift and let me hang around to see them in action, answering questions and looking up information on their wiki. For answers to my questions about the app, I was directed to the informative Tech blog where I found lots of information, starting with the announcement in September, 2014.
I took the app for a spin. Here are screenshots of my interactions:

Musings on Metadata in the context of a MOOC and DPLA
In the fall of 2013, I took my first Massive Open Online Course (MOOC) through Coursera . The course that caught my eye, and that I considered a good one for professional development, was titled, Metadata: Organizing and Discovering Information. Sure, I took a Metadata course while in library school, but that was years ago, six, to be exact. I knew I needed to catch up on the latest. Plus, I was curious about the distinction in experience.

Headline from Wired.com
Right off the bat, I was gratified by the course contents’ currency, as we say in library lingo. By the time I took the course, the term metadata had entered the vernacular thanks to the revelation that the NSA was/is collecting not actual phone conversations, but the metadata on all those calls. And, Apple had recently released its new OSX, Mavericks, with a cool tagging feature for users to apply metadata to categorize and color code files.
Every week, I logged in to my course to watch/listen to a series of 4-16 minute lectures given by the talking head/ professor teaching the course, Professor Pomerantz, an able and engaging faculty member from the School of Information and Library Science, University of North Carolina at Chapel Hill. In addition to his lectures, there were videos of guest speakers, adding an “in-practice” dimension to the subject matter and a benefit that was not part of my real time, in class experience. The lectures were also offered in downloadable format so I did not have to rely on Internet connectivity.
I didn’t have the time pressure of completing the 15 multiple choice question homework assignments by their weekly deadline since I was not on a Signature Track to earn a Certificate. However, I did want to assess my knowledge so I did do all the homework, and I had ten tries to get as many right as possible. If I needed a refresher on the topic, I watched a lecture again. I was quite satisfied with my experience in a MOOC; it was free professional development for a community of over a thousand people from countries around the world, all interested in learning how standards are used to make information discoverable.
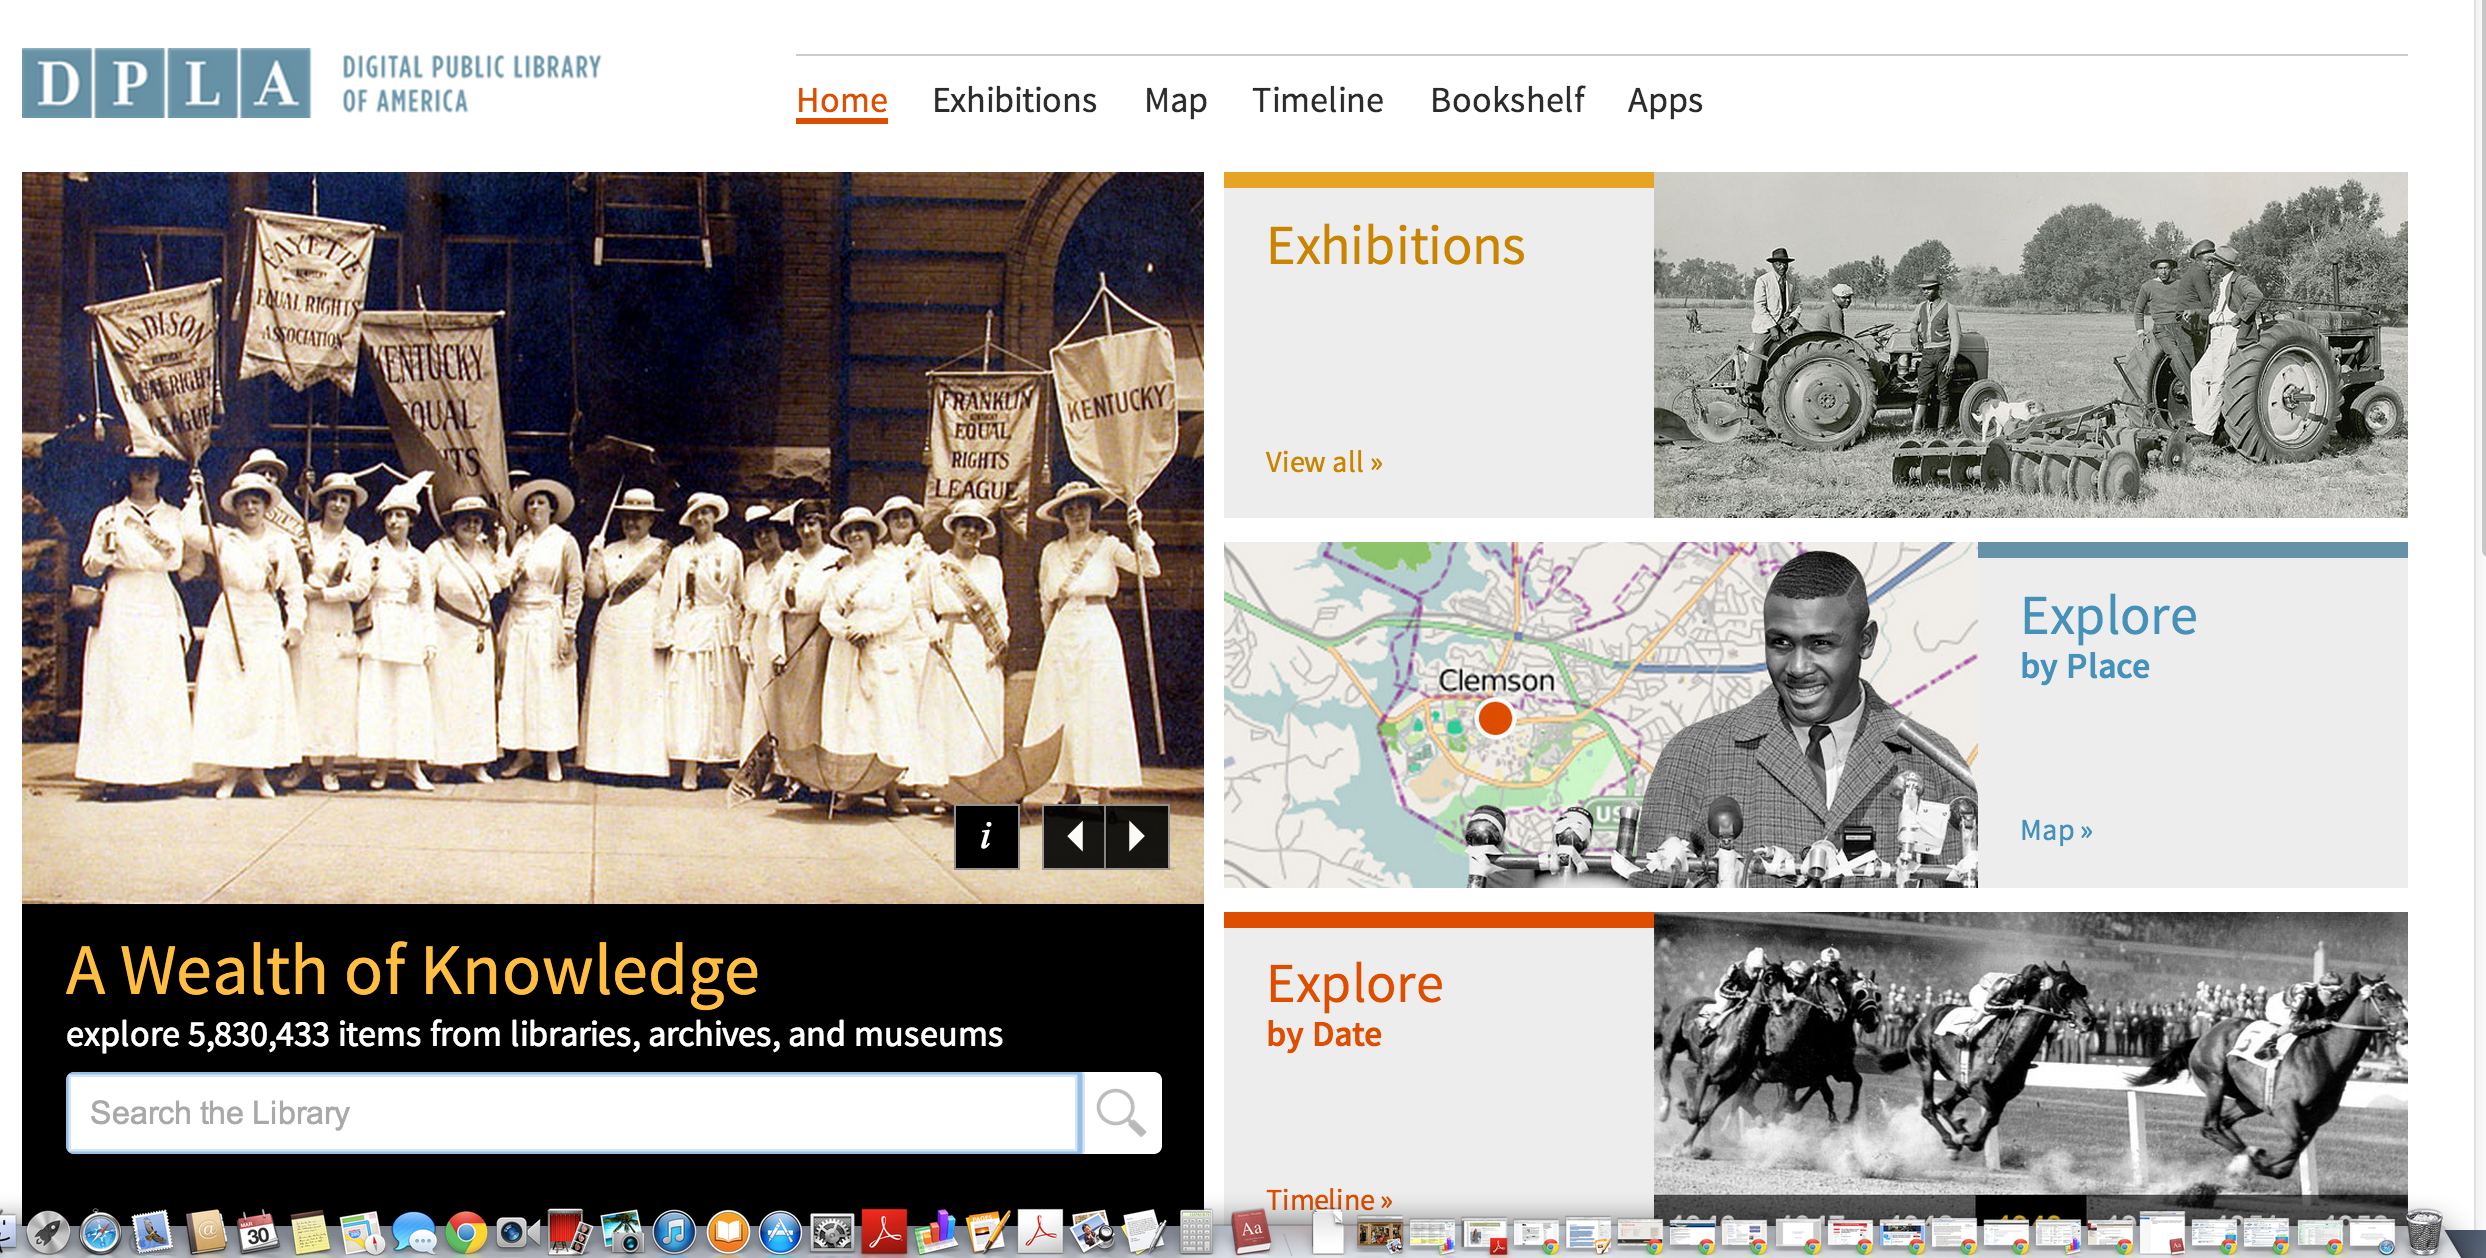
Not too long after I graduated from library school, I read Robert Darnton’s manifesto in the New York Review of Books on the possibility of creating a national public library. Finally, my dream of a world of silos of information opened for all was being presented by someone who has the capacity to make it a reality. But, when?

Less than two and a half years after the words were initially uttered to a receptive audience at a conference at Harvard in October 2010, the Digital Public Library of America is in its nascent form. DPLA in its current form is a repository of metadata from contributing organizations with APIs to connect to this metadata. DPLA provides a nice collection of online exhibits with content from contributing organizations, and some are the product of partnerships with content from Europeana. More and more institutions are getting on board through DPLA’s service hubs. I’m particularly excited by the Empire State Digital Network, a new service hub that the Metropolitan Library Council (METRO) will lead. One day, the Digital Library of America will be all that it promises, but in the meantime, as Jason Scott, archivist and technology historian extraordinaire has declared,

THATCamp Museums NYC 2012
 Last weekend I attended my first THATCamp (The Humanities And Technology, for those not in the know). This one was focused on Museums. Here was an opportunity to gather with like minded folk interested in the convergence of technology and museum content and experience, in order to learn about projects in the works presented in the workshops, to discuss ideas suggested by campers for sessions, and to collaboratively hack some of those ideas in real time. The icing on this enriching time was that it cost nothing, and we got breakfast and lunch to boot.
Those responsible for THAT Camps hail from the Roy Rosenzweig Center for History and New Media George Mason University. The popularity of THATCamps has grown to the point that there is a full time coordinator, Amanda French. Amanda is a busy lady. There are now THATCamps all over the world, with many focusing on a specific theme within a discipline. I will venture to say that these Camps are no longer limited to the Humanities. Amanda works with the Camp based coordinator(s) on the specifics of the THATCamp locale and theme. The local coordinators are responsible for the logistics, like finding a space to host the Camp, securing sponsors, setting up the website, promoting the THATCamp, etc. I mentioned the bonus of my free THATCamp experience but, unfortunately, they’re not always free and so generously sponsored. However, Amanda & Co. do their best to keep costs as low as possible.
Now for my personal experience at THATCamp Museums. On Friday, there were nine options for workshops to attend (THATCamps don’t always offer workshops). The workshops were organized with a theme so while my eyes lit up like a kid in a candy store, I was able to narrow down those that I most wanted to attend. My simple request to Kimon Keramidas, the coordinator for THATCamp Museums 2012, was for the three workshops in the Seminar Room at the Bard Graduate Center, the host of THATCamp Museums 2012.
The first workshop I attended, conducted by Amanda French, was on the ins and outs of Omeka, the open source web publishing tool for displaying collections and exhibitions. Yes, Amanda teaches, too. Like its multifaceted Amanda, The Roy Rosenzweig Center for History and New Media is responsible for Omeka.
The next workshop was on Smarthistory. I was encouraged when I first became aware of this free open online multimedia art history textbook alternative. I love that it provides an interactive immersive experience, so different from those dry art history texts with poor quality images that made me yawn back when I was studying art history. The affordance that ye olde technology enabled with the projection of images of works of art on a wall was what got my attention in those days, not the textbooks. The presentation by Beth Harris and Steven Zucker lived up to my expectations. Smarthistory has now reached the big time, joining the vast collection of educational resources at Khan Academy, thanks to a tweet from Beth Harris commenting on an article about Khan Academy.

The last workshop I attended was on Viewshare. Viewshare, an open source collection presentation platform, comes out of the Library of Congress’ National Digital Information Infrastructure and Preservation Program. Jefferson Bailey, Fellow at the Library of Congress’s Office of Strategic Initiatives, showed us how to create interactive maps and charts in Viewshare. My understanding is that Viewshare differs from Omeka in the features it offers.

Saturday morning the coordinators and campers launched into scheduling the sessions. There were so many great sessions proposed by campers; it was hard to choose which to attend. To allay the fear of winding up in a session that doesn’t grab a camper, one of the “rules” of THATCamp is “two feet,” encouraging campers to move on to another session when that’s the case.
The best way for me to process the information garnered from sessions that I attended is to mash it up. How can cameras and ipads in the gallery enhance the museum experience? Can curatorial collusion help represent and communicate information on digital material culture? Hmm.
The participants at the conference, Computers and their potential applications in museums; a conference sponsored by the Metropolitan Museum of Art, April 15, 16, 17, 1968, discussed ideas for how technology can support the study of the arts, yet we still have not achieved many of the goals set forth in that conference over forty years ago. Change happens slowly. It wasn’t until nearly twenty years later, at the Getty Conference in Pisa in 1984, Automatic processing of art history data and documents… , that Russell A. Kirsch, the first to scan an image in 1957, introduced the idea of using digitized images as surrogates for primary source material in his presentation titled “Making Art Historical Sources Visible to Computers: Pictures as Primary Sources for Computer-Based Art History Data.” Perhaps the work that comes out of THATCamp Museums can help accelerate change.
Okay, enough said here. I look forward to reading the Google docs for the workshop presentations and the session notes that campers generously documented and shared. And, another resource to refer to is the twitter stream of the hashtag #tcmny and thereby links to other resources, like this post, What I Learned at Camp, written for The Desk Set blog by fellow camper Meredith Wisner (who led a great session on Curatorial Collusion).
Information Sharing, Advocacy, Games
 For several weeks, I’ve had a niggling feeling that I have something to say. Finally, inspiration to write and post, after over a year of silence.
I learned about the source of my inspiration through an old-fashioned paper hand-out with an assignment that one of my daughters had to complete over this past winter break. The assignment was to see the exhibit Design with the Other 90%:CITIES, draw a picture about one of the projects represented and write about it. The exhibit, curated by the the Smithsonian Cooper- Hewitt National Design Museum, was on view at the U.N. Headquarters until January 9th. It featured “sixty projects, proposals, and solutions that address the complex issues arising from the unprecedented rise of informal settlements in emerging and developing economies .” Pretty lofty, I’d say. I wanted to learn more!
I did a little perfunctory research via Google. Nearly all of the links returned at the top of the list were directly to the website for the exhibit. One link went to a page on the Cooper Hewitt Museum’s website. It was on this page that I found out that the exhibit emerged from Design for the Other 90%, a similar Cooper-Hewitt exhibit from 2007 that featured affordable and socially responsible objects. There were a smattering of links to reviews on blogs. Way down the list was a link to a review on The Atlantic Cities. Appropriate. What about a review of the exhibit in the NY Times, I wondered. Not seeing a link in the search results, I went directly to its site and found an excellent review by Michael Kimmelman.
But, doesn’t the subject justify more than reviews of the exhibit? There is bona fide substance here, something that should get more visibility and support for the cause. So, how can those of us who believe that this issue warrants more public awareness do something about it?
Since I believe Jane McGonigal’s message, “Gaming can make a better world,” I look to games as a form of advocacy. (Has the term games-based advocacy been used yet?) So, I was happy to see that there are two games related to the exhibit. One, Future City Game, developed by British Council, Centre for Local Economic Strategies (CLES) and URBIS- Manchester’s Centre for Urban Life, is team-based design process that brings local residents and people from the public and private sectors together for two days to share their vision for the cities’ future. These players vote on urban planning and development ideas and present them to local stakeholders, professionals and residents. Forms of this game have been played in over one hundred cities since it was piloted in 2006!
The other is a series of games backed by the social initiative, Freedom HIV/AIDS. The Freedom HIV/AIDS games, played on mobile phones, were originally designed to educate India’s rural and semi-literate populations about the disease. When a player passes a level or answers a question correctly, informative texts are displayed on the screen. The games have been replicated in Kenya, Tanzania, and Uganda.
These games have been effective in both getting the public involved and in educating. You can head over to Games for Change to see more social and civic-minded games. Still, we need for these types of games to be massively multiplayer. Maybe more celebrities like Ellen DeGeneres can sing their praises, as she did for WeTopia. Come on folks, Let’s bring on the games!
Fantastic Voyage
 The stunning image caught my eye, as did the title. It was something about cinema and science. The web page with the article sat on my desktop for days, maybe even weeks, waiting to be read. Why was I surprised when it was gone? After all, this is a computer that I share with my husband and two daughters. Oh, why didn’t I bookmark it? Same reason that I do other neglectful things.
Lucky for me, a colleague sent along the link to the article just as I was scratching my head trying to place where I saw it. Where Cinema and Biology Meet. That was it, in the Science section of The New York Times, of course! Because it was the visual that caught my eye in the first place, I went straight to the video before reading the article. Being able to wander through molecules! Fantastic! In fact, it reminded me of the movie from the ’60s, Fantastic Voyage, amplified by the monumental advances in technology that occurred in the last 20 of the 45 years since the movie was made.
So, there I was earlier tonight, viewing a webcast of a joint meetup event between the Science Writers in New York and the NYC G4C meetup group. I did intend to go in person, after all it was a meetup, but was thrilled when I found out the event would be Livestreamed. Bonus! I could stay home and oversee homework (sort of) and watch the event live! The theme was The Future of Play and the panel of speakers included Asi Burak, the co president of Games for Change and also one of the co-founders of Impact Games, the creators of the game platforms “PeaceMaker” and “Play the News“, Colleen Macklin, Associate Professor at Parsons and Director of PETLab who I had the privilege of seeing before at a Games for Change conference in 2009, Chris Burke creator of the game within a game, This Spartan Life, that uses Halo as its backdrop, and Dr. Melanie Stegman, program director of Educational Technologies at the Federation of American Scientists and project director of the game Immune Attack. Josephine Dorado, the moderator, teaches at the New School and is the live events producer for This Spartan Life.
Worried that the sound quality would be poor, I was reassured when I could hear just fine, through headphones, when necessary, and through the computer’s speaker. There were a few technical difficulties during Asi Burak’s presentation, limiting what he was able to present. But, that didn’t matter much to me because we, the five to six Livestream viewers, rarely got to see what was on the screen anyway. Colleen Macklin went through the history of games during which time I watched her turn her head to see the screen but couldn’t see it myself. I was glad that the question about slide availability came up; I look forward to seeing those. Melanie Stegman was the highlight for me. She talked about how players navigate through parts of the body in the educational game, Immune Attack, and are thus immersed in the experience. There was that Fantastic Voyage image going through my head again. That was better than having to watch yet another milk ad and missing about 15 seconds of a talk (every 15 minutes). Though, I am not complaining. It’s a small cost for free cloud based services.
At eight thirty when the moderator ended the presentations, the panelists could be overheard talking about… what else? Fantastic Voyage.
About Iris Finkel
| I am a librarian observing how new media is altering the flow of information in the 21st century. Occasionally, I record my observations here.
Digital Projects: FashionInDH.org |
 Paul Otlet’s vision, c. 1930s |
-
Archives
- June 2020 (1)
- May 2019 (1)
- April 2019 (1)
- May 2018 (1)
- November 2015 (1)
- June 2015 (1)
- April 2014 (1)
- May 2012 (1)
- January 2012 (1)
- December 2010 (1)
- September 2010 (1)
- May 2010 (1)
-
Categories
-
RSS
Entries RSS
Comments RSS
